
Analytics
eCommerce analytics for DTC brands
Know every sale and how to get more
Sales, conversion, traffic and payments in one dashboard, counted from your own checkout. Stop comparing Shopify, Meta and GA4 to guess which number is right.
See the reports
No credit card · Included in every plan · 24/7 human support

4,600+ brands have processed $3.5B+ on Funnelish
Interactive demo with example figures, based on the Funnelish Analytics overview. Click any metric to chart it, switch Live and Test, or turn the comparison off.
Overview
Your whole business on one screen
Revenue, orders, top products and traffic, each next to last period. Open it in the morning and know in a minute whether yesterday was a good day.
Top products
by revenue
Illustration

Top seller
Daily Greens drops
$38,420
46% of revenue · ▲ 14% vs previous

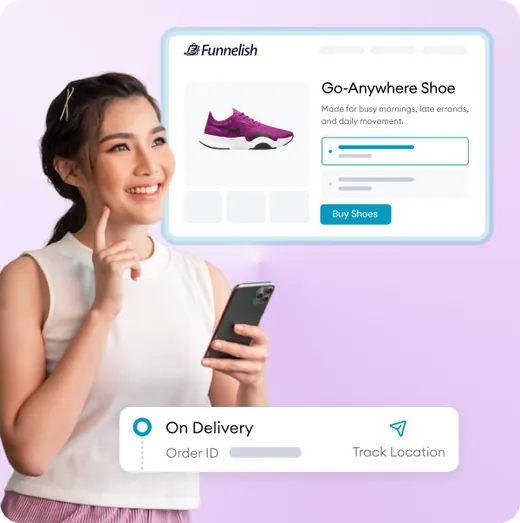
Go-Anywhere Shoe
$21,960

Wireless earbuds
$12,140

Silicone case · order bump
$6,890
+ 6 more products
$4,800
Conversion rates
Find where buyers drop off
Know which funnel sells, how many shoppers finish checkout, and how many say yes to your upsell. Then fix the weakest number first.
✓
Conversion for every funnel. Rank your funnels and see the one that wastes traffic.
✓
Checkout completion. The share of shoppers who start checkout and pay. A low number means the checkout needs work.
✓
Upsell take rate. The share of paid orders that add your upsell. Every point lifts your AOV. One-click upsells
✓
Test the fix. Split-test the weak page and keep the version that sells more. How split tests work
Conversion rates
Last 30 days
Illustration
Overall conv. rate
3.40%
+0.13pt
sessions to orders
Opt-in rate
5.43%
+0.31pt
of sessions
Checkout completion
31.1%
−1.8pt
of checkouts started
Upsell take rate
28.4%
+2.2pt
of paid orders
Where buyers drop off
by funnel
Summer launch
Bundle offer
Subscribe & save
Skincare quiz
18,420
Landing page
2,140
16,280 left
11.6%
Checkout
752
1,388 left
35.1%
Order
230
522 left
30.6%
Upsell
9,860
Landing page
1,150
8,710 left
11.7%
Checkout
351
799 left
30.5%
Order
101
250 left
28.8%
Upsell
4,760
Landing page
520
4,240 left
10.9%
Checkout
115
405 left
22.1%
Order
31
84 left
27.0%
Upsell
7,310
Landing page
600
6,710 left
8.2%
Checkout
154
446 left
25.7%
Order
28
126 left
18.2%
Upsell
Each bar = shoppers who reached the step before
Moved to the next step
Moved to the next step
Live view
Watch your launch live
Launch day, an email drop or a new ad: see visitors, checkouts and purchases minute by minute. If something breaks, you know before the ad budget is gone.
✓
Right now, not tomorrow. Active sessions, checkouts started and purchases as they happen.
✓
Per funnel. See which funnel the live traffic is on, and click to filter.
✓
Devices and countries. Know if your buyers are on mobile and where they are.
Payment methods · 5 providers · last 30 days
Illustration
Provider
Acquisition rate
Fail rate
Orders
S
Stripe
92.9%
7.1%
754
A
Airwallex
94.7%
5.3%
268
P
PayPal
97.7%
2.3%
167
A
Checkout.com
92.1%
7.9%
151
K
Klarna
91.4%
8.6%
32
1,465 purchase attempts · 93 failed
Highest fail rate: Klarna 8.6%
Payment methods
Catch the payments that fail
A failed payment is a buyer who already decided to pay. See which provider approves the most orders and which one is costing you sales.
Payment methods · 5 providers · last 30 days
Illustration
Provider
Acquisition rate
Fail rate
S
Stripe
92.9%
7.1%
A
Airwallex
94.7%
5.3%
P
PayPal
97.7%
2.3%
A
Checkout.com
92.1%
7.9%
K
Klarna
91.4%
8.6%
1,465 purchase attempts · 93 failed
Highest fail rate: Klarna 8.6%
✦
Approval and fail rate per provider. Stripe, PayPal, Klarna, Airwallex, Checkout.com and more, side by side.
✦
Failed purchases you can count. Every attempt and every failure, so lost sales stop hiding.
✦
Express checkout share. See how many buyers pay in one tap.
✦
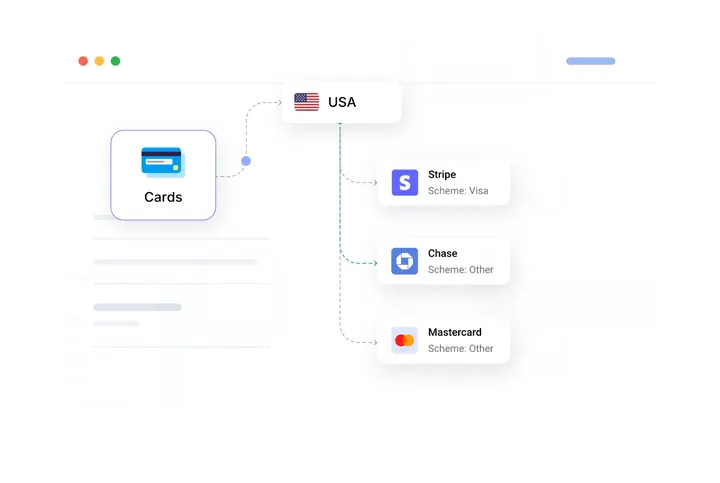
Fix it with routing. Send payments to the gateway that approves more. Smart payment routing guide
Traffic & UTM tagsLive view
See which traffic actually buys
Clicks don't pay the bills. Compare every source and campaign by the orders, revenue and AOV it brought in, then put your budget where buyers come from.
UTM tags
Last 30 days
Illustration
Tagged traffic
91%
of sessions carry UTM tags
Untagged revenue
$3,781
has no source yet
Tag combinations
46
seen this period
UTM source
Orders
AOV
Revenue
M
meta
702
$63.05
$44,260
G
331
$58.40
$19,330
T
tiktok
118
$57.20
$6,750
K
klaviyo
96
66.50
$6,384
AI
chatgpt.com
52
$71.25
$3,705
–
(not set)
73
$51.79
$3,781
✓
Orders and revenue per campaign. Group by any UTM tag: source, medium, campaign or ad.
✓
Know what you can't track yet. Untagged revenue shows the sales with no source, so you know which links to tag.
✓
See AI traffic too. Visits from ChatGPT and Gemini show up as their own sources.
✓
Tags survive checkout. Buyers stay on your domain, so the UTM stays on the order. How UTM tracking works
UTM tags
Last 30 days
Illustration
Tagged traffic
91%
of sessions carry UTM tags
Untagged revenue
$3,781
has no source yet
Tag combinations
46
seen this period
UTM source
Sessions
Orders
Conv. rate
AOV
Revenue
M
meta
21,400
702
3.28%
$63.05
$44,260
G
8,070
331
4.10%
$58.40
$19,330
T
tiktok
4,840
118
2.44%
$57.20
$6,750
K
klaviyo
1,200
96
8.00%
66.50
$6,384
AI
chatgpt.com
1,210
52
4.30%
$71.25
$3,705
–
(not set)
3,630
73
2.01%
$51.79
$3,781
For the whole team
Every role gets a clear answer
Your team asks different questions. Analytics answers each one with a number they can act on today.

Founder
Are we growing?
✓
See if revenue and AOV grow
✓
Know your best sellers
✓
Check agency results

Growth lead
What should we scale?
✓
Spot traffic that converts
✓
Find funnels to improve
✓
Know what to test next
Agency or media buyer
Did my campaigns sell?
✓
Show sales per campaign
✓
Keep test orders out
✓
Export client reports
Compare before your next ad spend
Against the reports you pay for now
Most brands piece these numbers together from a store, two or three apps and a spreadsheet.
Store + apps + spreadsheet
Funnelish
Sales, orders, AOV
✕
Store report, copied to a sheet
✓
One screen, against last period
Traffic that buys
✕
GA4 sessions, no orders
✓
Orders and revenue per UTM tag
Conversion by funnel
✕
Separate analytics app
✓
Every funnel, plus checkout completion
Upsell results
✕
Inside the upsell app
✓
Upsell take rate next to AOV
Failed payments
✕
Each gateway's own dashboard
✓
Approval and fail rate per provider
Launch-day activity
✕
Refreshing three tabs
✓
Live view, minute by minute
Related reading
Turn the numbers into more sales


FAQ
eCommerce analytics, answered
Funnelish Analytics is the reporting built into Funnelish. It shows revenue, orders, AOV, conversion rate, sessions and earnings per click for your funnels, compared with the previous period, plus reports for traffic, UTM tags, conversion rates, payment methods, devices and a live view.
Each tool counts in its own way. Meta credits a sale up to 7 days after a click or 1 day after a view by default, so two channels can claim the same order. GA4 and pixels miss visits when ad blockers or consent banners stop them. Funnelish counts the orders its own checkout took, so its totals match the orders in your store.
Keep them if you split ad credit across many channels. Funnelish shows what happened once a shopper reached your funnel: sessions, orders, revenue and the UTM tag that brought them. Many brands use it to check what their ad tools claim.
Yes. The UTM tags report groups your traffic by any UTM tag and shows sessions, orders, opt-ins, conversion rate, AOV and revenue for each. UTMs stay on the order because buyers check out on your own domain. UTM tracking
The share of paid orders where the buyer also took your upsell. It sits in the conversion rates report, next to checkout completion: the share of started checkouts that end in a paid order. One-click upsells
Earnings per click: how much revenue each visit to your funnel brings in on average. It helps you compare traffic sources that send very different volumes.
Yes. The payment methods report shows each provider's acquisition rate, purchase fail rate, failed purchases, express checkout rate, orders, AOV and revenue. Smart payment routing can then send payments to the gateway that approves more. Smart payment routing
Yes. Live view shows active sessions, checkouts started and purchases as they happen, activity per minute, sessions by funnel, devices and top locations.
No. Switch between Live and Test at the top of analytics, so test orders stay out of your real numbers.
Yes. Download the data from a report to use in your own spreadsheet or a client report.
A profitability report is coming soon. Today, analytics covers revenue, orders, AOV, EPC and conversion.
Yes. Keep Shopify as your store. Orders from your Funnelish checkout sync to Shopify, upsells included as one order, so your team ships them as usual. Shopify integration
Analytics is part of Funnelish plans, from $49 a month with 0% platform transaction fees. Start with a 14-day free trial, no credit card required. See plans
Know what's working by tomorrow morning
Start a free trial, launch a funnel, and your dashboard fills in as orders come in.
4,600+ brands have processed $3.5B+ on Funnelish
No credit card required · Free migration · Cancel anytime
